Data Quality
Part of Ecommerce experimentation
Checking for sample imbalance in an ecommerce experiment
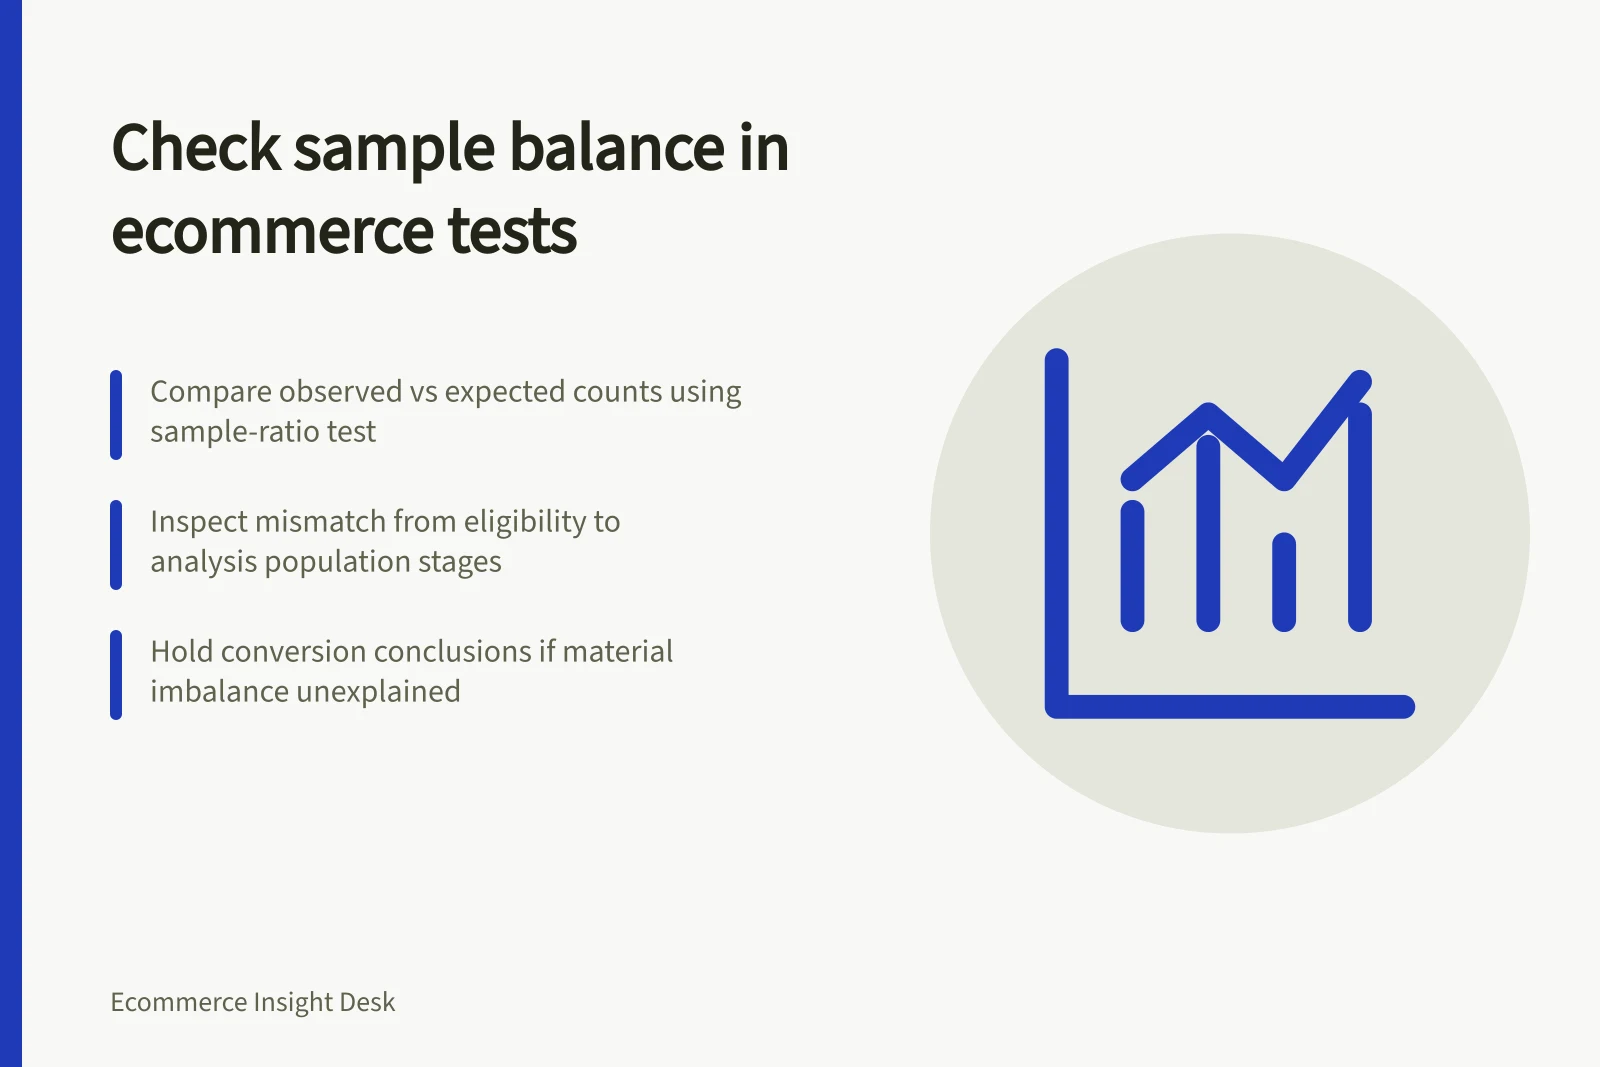
Compare observed experiment units with the planned split, trace where imbalance begins and decide whether the store-test result can be used.
Check sample imbalance by comparing distinct units observed in each variant with the allocation configured for those units. Use an appropriate sample-ratio test, then investigate a persistent mismatch before interpreting conversion lift. Unequal counts alone do not prove a fault: random variation, sample size and planned allocation changes all matter.
Reconstruct the expected counts
Start with the allocation history. Record the planned share for each variant, start time, ramp changes and eligible population for each period. If the split changed, calculate expected counts for the relevant periods rather than applying the final ratio to the whole run.
Count the randomisation unit, such as a shopper or account, once under the experiment's assignment rule. Page views, sessions and orders are different units. Check whether returning units retain their variant and whether exclusions were applied as planned.
Compare counts at assignment and at eligible exposure separately when both are available. An exposure log can be missing or can depend on a condition affected by the variant. An apparently balanced assignment therefore does not guarantee a balanced analysed population. A valid triggered analysis needs an eligibility condition that could identify comparable control units.
For a stable allocation, a sample-ratio test compares observed counts with the expected counts. Statsig documents a chi-squared test of its exposure counts, but another platform may use a different check. The alert identifies a trustworthiness question, not its cause. A small percentage gap can be striking with many units, while a larger-looking gap in a small sample may be ordinary variation.
Experiment Allocation Changes Over Time
- 1Start: October 2026 — 50% A, 50% B split for all shoppers
- 30October 2026 – Final Analysis — Final population includes both original and ramped segments
Find where the mismatch begins
Compare counts through eligibility, assignment, rendering, exposure logging and the final analysis population. Look for the first stage at which the ratio changes.
First mismatch appears / Check next
- At assignment
- Eligibility, bucketing key, configured split and ramp history.
- Between assignment and rendering
- Redirects, loading failures and variant-specific routes.
- Between rendering and exposure logging
- Missing requests, consent handling and variant-specific logging.
- After analysis filters or joins
- Identifiers, duplicate records and conditions applied differently.
Inspect the pattern over time and by device or route where counts permit. These are diagnostic possibilities, not findings about a store. Do not filter to people who interacted with a treatment-only element: that condition cannot select equivalent control shoppers without a valid counterfactual rule.
Diagnosing Sample Imbalance in an Ecommerce Experiment
- Check assignment counts against planned allocationVerify bucketing key and eligibility rules applied correctly
- Review rendering stageCheck for redirects or loading failures affecting variants
- Inspect exposure loggingEnsure consent handling and tracking events are consistent across variants
- Validate final analysis populationConfirm no variant-specific filters or joins skewed the data
Decide whether the result can be used
Changing reported weights does not recover shoppers missing because of a broken or treatment-dependent path. Establish the cause and its effect on the analysed population. If a clean period can be isolated under the original question, explain why; if the affected population cannot be recovered, a new run may be needed.
If a segment is excluded after diagnosis, retain the original result and state how the question and population changed. Record configured ratios, counts at each stage, the test method, verified cause and disposition. Hold the conversion conclusion while a material mismatch remains unexplained. A persuasive purchase-rate difference does not repair the comparison.
Using Results with Unresolved Sample Imbalance
- ProsIf a clean period is isolated under original conditions, results may still be valid for that window
- ConsChanging reported weights does not fix missing data from broken paths; cannot recover lost shoppers