Measurement Planning
Part of Ecommerce dashboard design
Removing metrics that do not inform a trading decision
Every daily dashboard metric should answer a question or trigger an action. If it only fills space, move it to a detailed report or retire it.
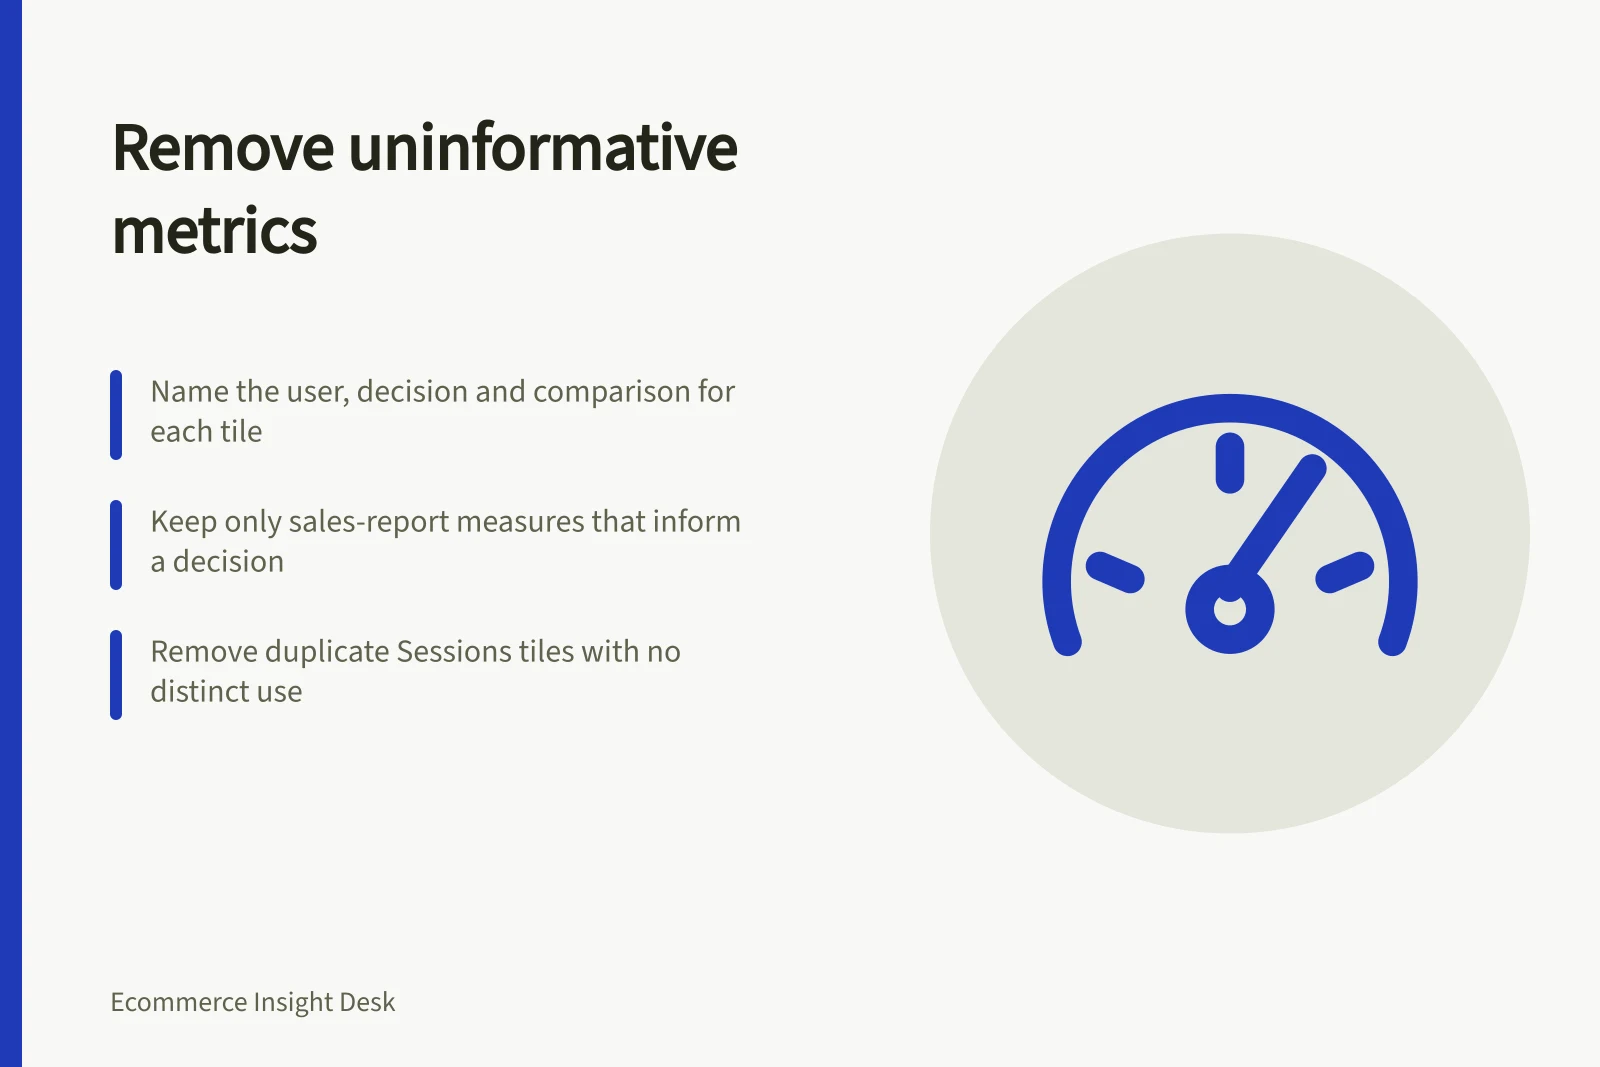
For each tile, name its user, the decision it changes and the comparison that makes the change meaningful. If no one can name a decision, remove the tile from the daily view, not the underlying report or data.
To investigate a sales drop this week compared with last week, retain Sales over time and the breakdowns by channel, product and traffic source. These are the breakdowns Shopify identifies for investigating sales changes.
Orders, Average order value, Units per transaction, Gross profit, Discounts and Gross sales are available sales-report measures, not automatic daily tiles. Keep each only when an owner can name the decision it informs; otherwise remove its tile and retain the underlying report if someone needs it.
Remove similar Sessions tiles from the same screen unless each has a distinct decision use. Shopify and third-party analytics can differ because Google counts every page reload while a browser doesn't count reloads of cached pages; session definitions, bot counting and reporting time zones can also vary.
Watch a real trading review: note which tiles people discuss, which prompt them to open a report, and which are ignored or repeatedly explained away. Check whether a less-frequent owner needs a metric for a separate task before removing it from the daily view.
Record each removed metric, why it was removed, where it can still be found, its owner and a review date. Tell the owner and affected users; restore the tile at review if a trading decision needs it.
Shopify vs Google Analytics session definitions
- Page reloads
- Shopify: counts all reloads; Google Analytics: excludes cached page reloads
- Bot traffic
- Shopify: includes bots; Google Analytics: may filter bots by default
- Reporting time zone
- Shopify: uses store’s local time zone; Google Analytics: uses configured reporting timezone
Key sales metrics for trading decisions
- Sales over time
- Essential for trend analysis and anomaly detection
- Breakdown by channel
- Identifies performance shifts across marketing and sales channels
- Breakdown by product
- Highlights top-performing or underperforming SKUs
- Breakdown by traffic source
- Helps assess campaign effectiveness and referral quality